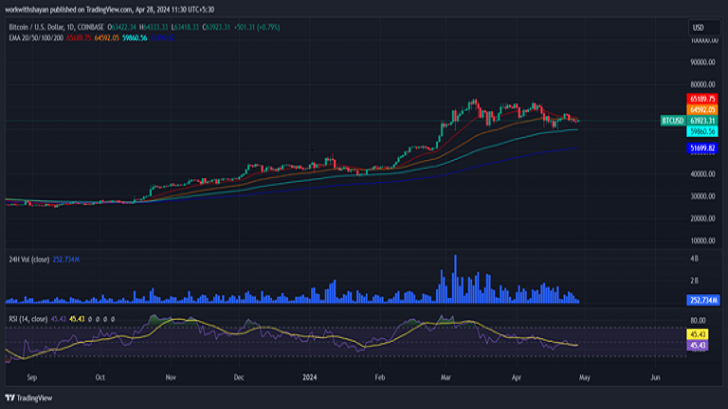
Bitcoin Price Prediction: Is a 7% Rally Coming, or Will BTC Sink?

Bitcoin’s price prediction is becoming a hot topic as market analysts weigh the potential outcomes for this leading cryptocurrency. Bitcoin (BTC) has shown bullish momentum following a symmetrical triangle pattern breakout. Investors are now asking: Will BTC rally by 7%, or could it face a sharp decline? Understanding key price levels is crucial for predicting Bitcoin’s short-term movement.
BTC’s Breakout and Support Levels
Bitcoin recently broke out of a symmetrical triangle pattern, which formed by connecting several lower highs and higher lows since May. This pattern is significant, as symmetrical triangles often signal potential price movements. The breakout, however, faced rejection at the weekly resistance level of $71,280, creating uncertainty about whether BTC will continue its upward trend.
BTC is now holding support around the upper boundary of the symmetrical triangle, near $68,500. This level serves as a key area for bullish traders, as maintaining support here could fuel a further rally. If Bitcoin stays above this boundary, it could climb another 7% toward its all-time high of $73,777.

Cryptopolitan | MSN | Bitcoin breaks out but faces resistance near $71,280, with support holding around $68,500.
A Bullish Scenario: 7% Rally in Sight?
If Bitcoin sustains its current support level, traders could witness a significant 7% rally. This potential move would bring Bitcoin closer to its record high, which is an essential psychological and technical milestone. A rally of this size would attract more investors, reinforcing the bullish narrative and possibly setting the stage for even higher gains.
The price action depends on Bitcoin holding above $68,500. If it can successfully defend this level, confidence in the market will likely grow, propelling the cryptocurrency toward new highs. However, the market remains volatile, and traders need to stay alert to sudden shifts in sentiment.
Could BTC Sink?
While the bullish scenario seems promising, there is also a downside risk to consider. The bullish thesis could be invalidated if Bitcoin fails to maintain support at the $68,500 level. A drop below this critical level could signal the start of a downtrend, leading to a potential 8% decline.
Should BTC close below $67,147, the lower boundary of the symmetrical triangle, the market could experience a sharp sell-off. In this case, Bitcoin may fall toward the next daily support level of around $61,293. Such a drop would erase recent gains and weaken market confidence, prompting traders to reassess their positions.
Key Resistance and Support Levels to Watch
Monitoring Bitcoin’s key price levels is essential for investors looking to make informed decisions. The $68,500 support zone remains crucial for sustaining upward momentum. Meanwhile, the $71,280 resistance will likely challenge the bulls if BTC attempts another rally.
On the downside, a breach of $67,147 could trigger a larger sell-off, pulling Bitcoin down to its next major support level of around $61,293. Staying informed on these levels will help traders navigate the volatile crypto market.

Tima Miroshnichenko | Pexels | Monitoring Bitcoin’s key price levels is essential to making informed decisions.
What Traders Should Expect Next
The coming days will likely be pivotal for Bitcoin’s price action. Holding above the $68,500 support level offers a promising outlook, as it could lead to a 7% rally and possibly challenge the all-time high. However, a break below $67,147 would invalidate the bullish scenario and potentially lead to a deeper correction.
For now, Bitcoin remains in a delicate position, with both bullish and bearish scenarios still in play. Traders should monitor market developments and prepare for rapid shifts in momentum.
More inTrade & Markets
-
How to Make Money on TikTok – 8 Proven Strategies
TikTok isn’t just a platform for viral dance challenges and funny skits anymore. It’s a goldmine of opportunity for creative minds...
June 6, 2024 -
Tech Giant Cisco Likely to Lay Off ‘Almost 350’ Employees As Part of Its ‘Restructuring Plan’
Is your favorite tech company feeling the pinch? Recent reports suggest that Cisco (CSCO) is planning to lay off ‘almost 350...
May 31, 2024 -
How Many Mortgages Can You Have? Understanding the Limits
Are you pondering the idea of delving into the realm of multiple mortgages? Whether it’s for expanding your property portfolio, securing...
May 23, 2024 -
What You Ought to Know About Dominican Republic Rum
When you think of the Dominican Republic, your mind might drift to images of beautiful beaches and vibrant dance rhythms. But...
May 16, 2024 -
Are Mobile Homes Worth Investing? A Deeper Look
Are mobile homes a good investment? This question often pops up among potential homeowners and investors alike, looking for an affordable...
May 9, 2024 -
10 Best Stocks to Invest in 2024 for Smart Investors
In a world where economic growth seems to be hitting the brakes, the hunt for the best stocks to invest in...
April 30, 2024 -
Will Breaking a Lease Affect Your Credit? The Real Impact
Breaking a lease isn’t just about packing up and moving on; it’s a decision that can have lasting financial implications. While...
April 23, 2024 -
Is Traveling a Hobby? Exploring the Reasons and Ways to Travel More
Have you ever scrolled through social media and stumbled upon the question, “Is traveling a hobby?” It’s a thought-provoking query that...
April 16, 2024 -
Who Owns the Playboy Mansion? Revealing the Current Owner
The story of the Playboy Mansion is as intriguing as the parties it once hosted. Nestled in the heart of Los...
April 9, 2024


You must be logged in to post a comment Login